Different
Capabilities of Charts in CRM
 2. We
will combine the multi series chart to create a single series chart and will
change the color palette to make it look different. Palette color here is
Bright.
2. We
will combine the multi series chart to create a single series chart and will
change the color palette to make it look different. Palette color here is
Bright.

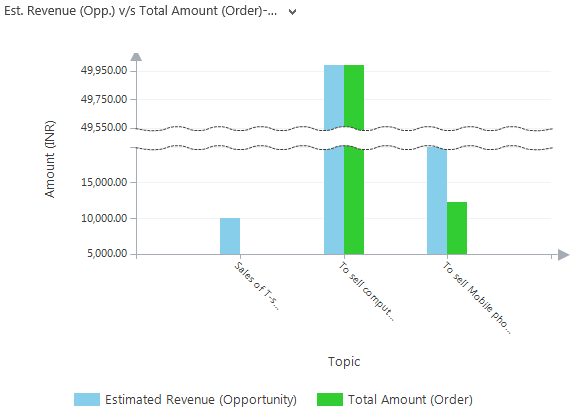

Here
we have a basic chart which shows Estimated Revenue from Opportunity v/s Total
Amount from Order. Then later we will modify the XML to show its charting
capabilities.

1. We
will modify the title of both the axis as well as of legend and will remove the
label from the top of column. Also will increase the font size for overall
chart. The output chart after modification is as shown below
3. Now
we will make the chart more readable and attractive by modifying the label and
arrow style.
Also
will with the margin to make it more understandable. 
4. We
can also break the scale of a chart when it contains higher range values. Also
we can step the label to a particular degree (here 45 degree) to make text
adjustable and readable. Here we change the Palette color to Pastel.
5.
We
can also create 3D charts as shown below
6. Apart
from column we can create soft edge doughnut, square base funnel chart, pie
chart and 3D cylinders chart as shown below


No comments:
Post a Comment